سیستم ناوبری جهانی
وبلاگی جهت گسترش علم ژئودزی ماهواره ایسیستم ناوبری جهانی
وبلاگی جهت گسترش علم ژئودزی ماهواره ایبررسی فعالیت های هسته ای با GNSS و مشاهدات نجومی رادیویی
در شماره اوت GPS WORLD مقاله جالبی ارائه شده که یکی از کاربردهای خاص GNSS است.
GNSS and Radio Astronomical Observations
البته ماهواره های GPS تجهیزاتی برای کشف فعالیت های هسته ای دارند که اتفاقا باند L3=1381.05 MHz
بدین منظور اختصاص داده شده است تا اطلاعات مربوط به وقایع مادون قرمز با انرژی بالا را به بخش کنترل ارسال کند.
شفق قطبی

This ultraviolet image shows an auroral display as seen from space, overlaid on top of a visible image of Earth. The false-color reds indicate the brightest aurora and blue the dimmest. The brightest aurora is found at midnight.

The ethereal green glow of Aurora Australis high over Concordia station on 18 July 2012. It was taken by ESA-sponsored scientist Alexander Kumar and his colleague Erick Bondoux from about 1 km from the station, located in the Antarctic at –75°S latitude.
The French–Italian Concordia station's programme of research includes glaciology, human biology and the atmosphere. ESA uses the base to prepare for future long-duration missions beyond Earth. During the winter, Concordia is under almost total darkness, with an average temperature of –51°C and a record low of –85°C. It is an ideal place to study the effects on small, multicultural teams isolated for long periods in an extreme, hostile environment.
Auroras occur frequently over both the North and South polar regions, but are often difficult to see from populated areas. During periods of increased solar activity, the lights sometimes extend to populated latitudes. This year has seen unusually high solar activity; most recently, on 14 July, Northern Lights could be seen as far south as Duluth, Minnesota, USA.
منبع :esa
Solar Maximum
سلام
این روزها به ماکزیمم فعالیت های خورشیدی نزدیک می شویم:
http://en.wikipedia.org/wiki/Solar_maximum
روزهایی که این پدیده گزارش می شود می توانید مقدار اثر آنرا بر روی یونسفر ببینید:
اگر روی کامپیوترتان Google Earth دارید پس از سایت زیر نقشه های TEC را در فرمت KML دانلود کنید و در گوگل ارث نگاه کنید.
http://sol.spacenvironment.net/~ionops/ES4Dintro_public.html
تغییرات میل مغناطیسی
سلام
نقشه ی تهران در سال 1270 هجری قمری نشانگر سه درجه میل مغناطیسی به سمت غرب است (توضیحات بالای نقشه)! در حالیکه در حال حاضر این میل حدود چهار درجه به سمت شرق است! با در نظر گرفتن تغییرات سالیانه که حدود 3.5 دقیقه در سال به سمت شرق است، این مسئله صحیح است.
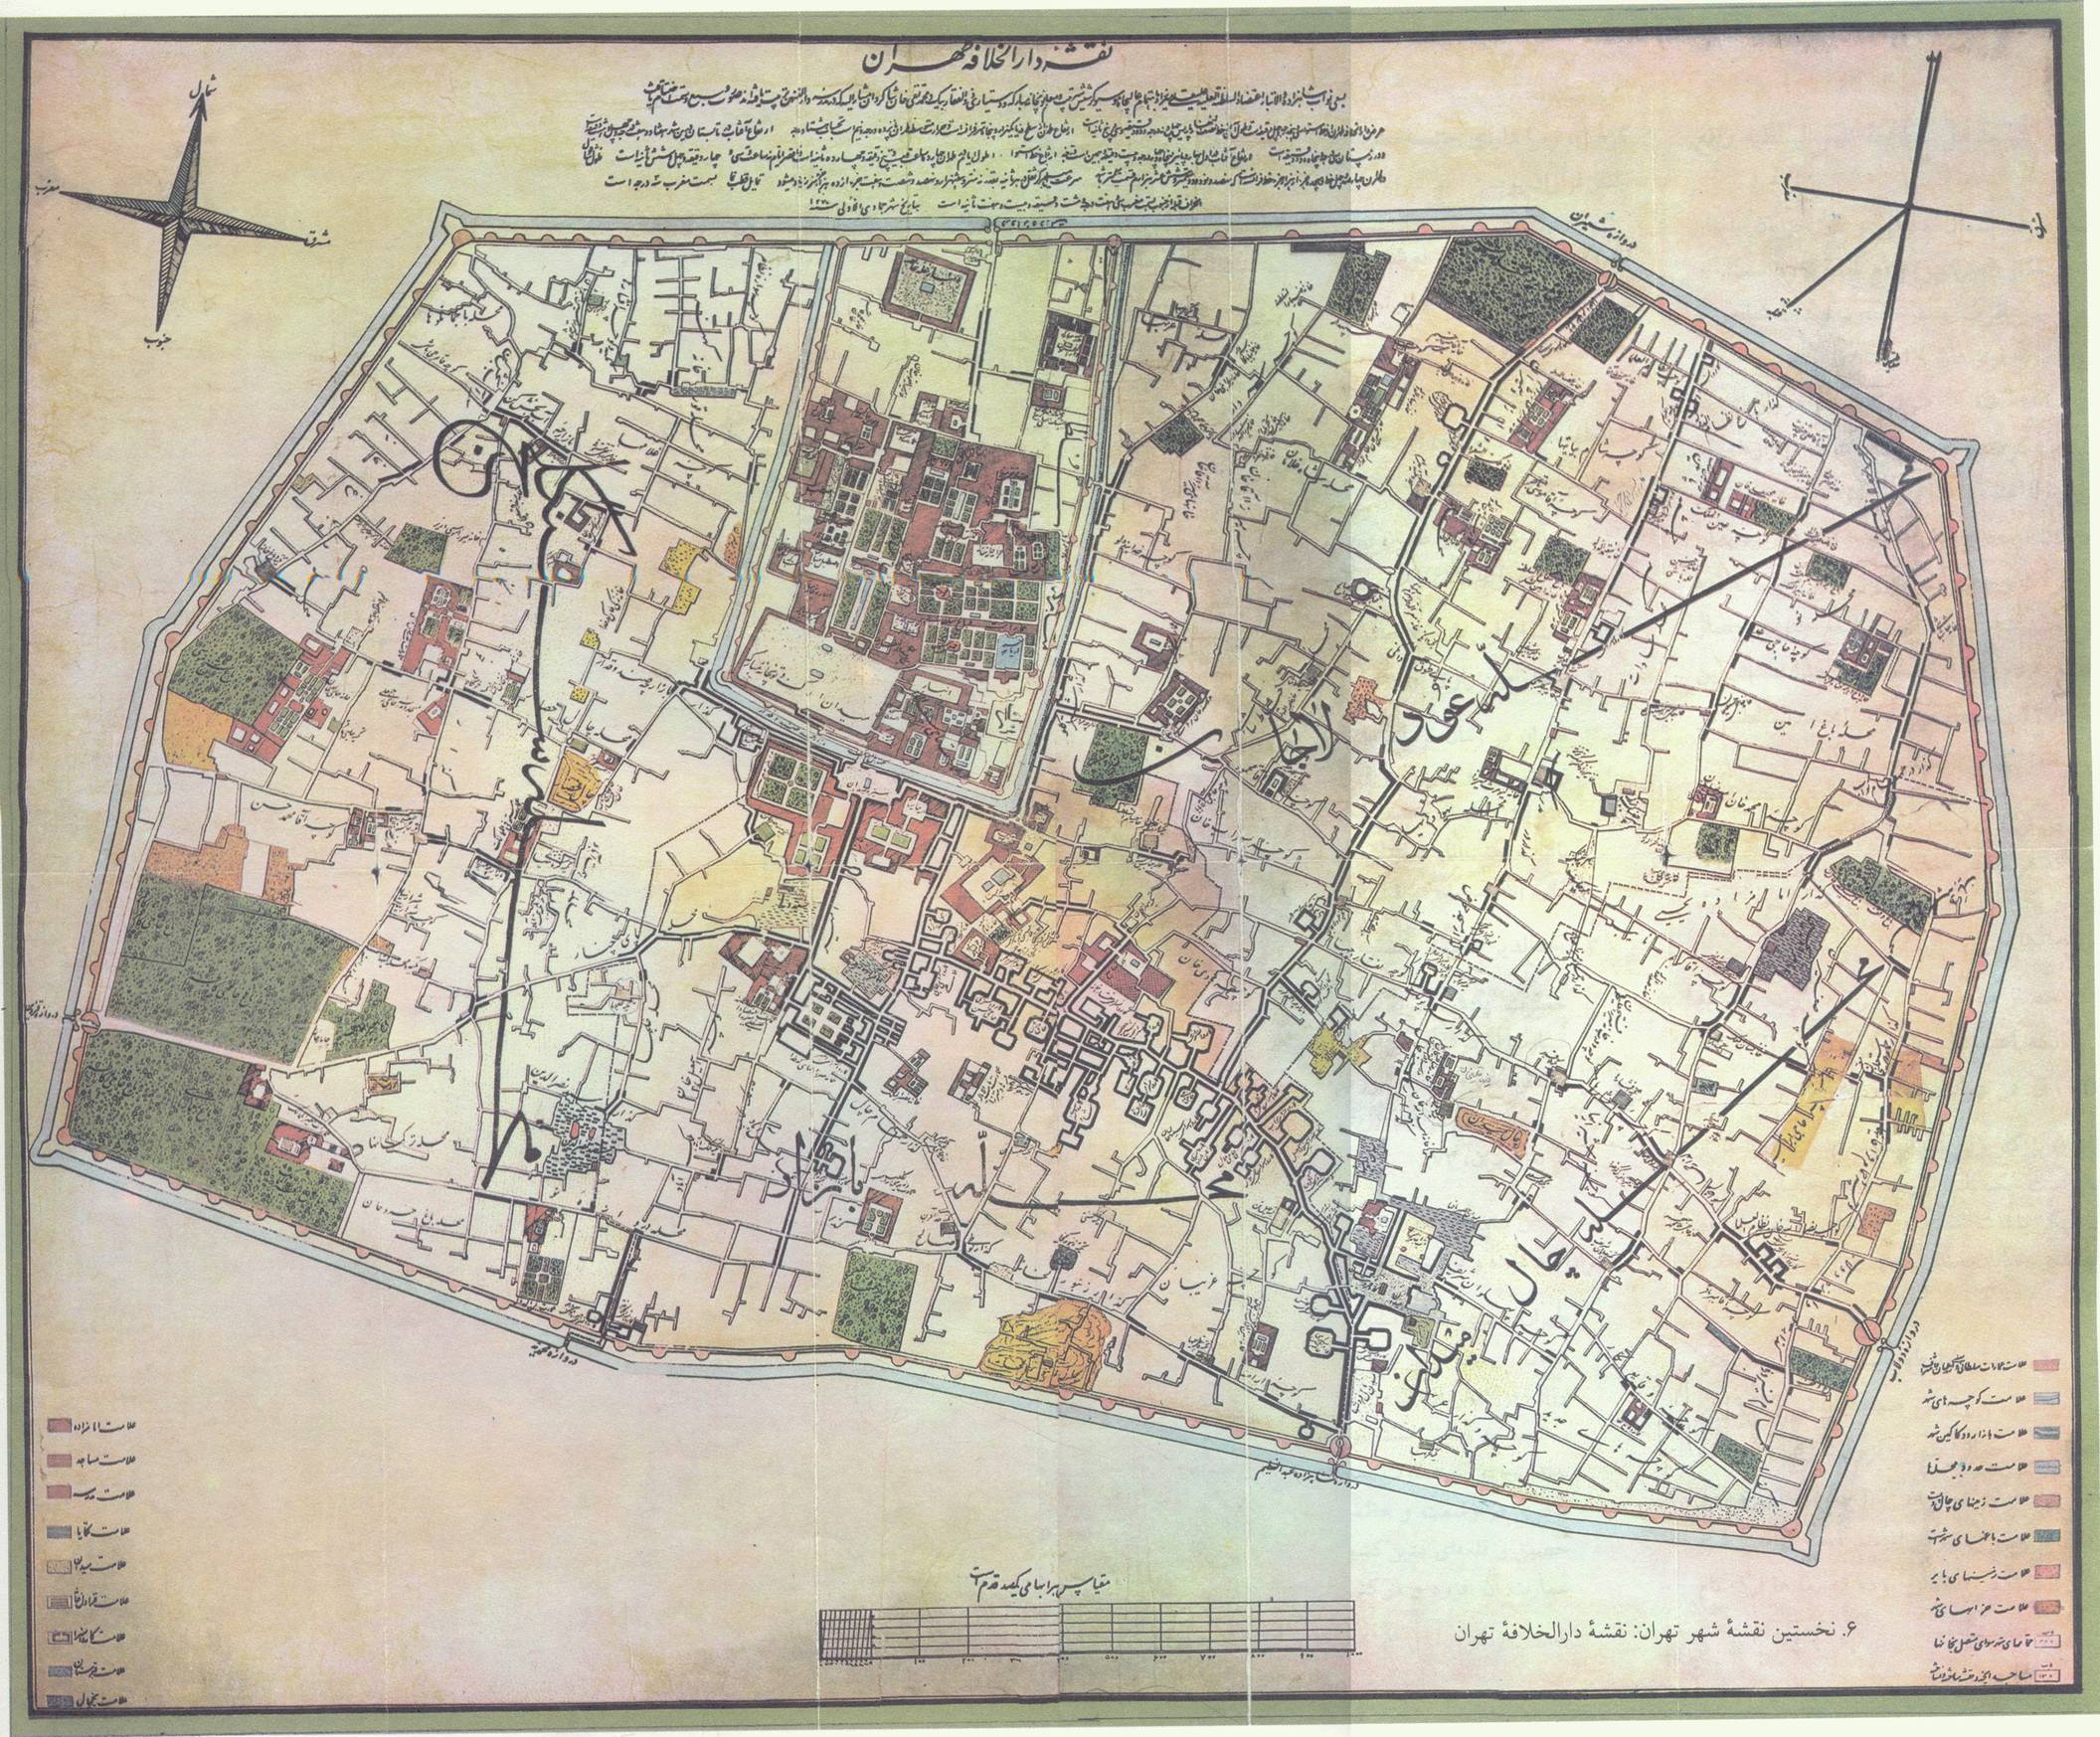
شکل زیر تغییرات بلند مدت میل مغناطیسی را به صورت انیمیشن نشان میدهد.
برای محاسبه به لینک های زیر مراجعه کنید:
http://www.ngdc.noaa.gov/geomagmodels/Declination.jsp
http://www.ngdc.noaa.gov/geomag-web/#igrfwmm